


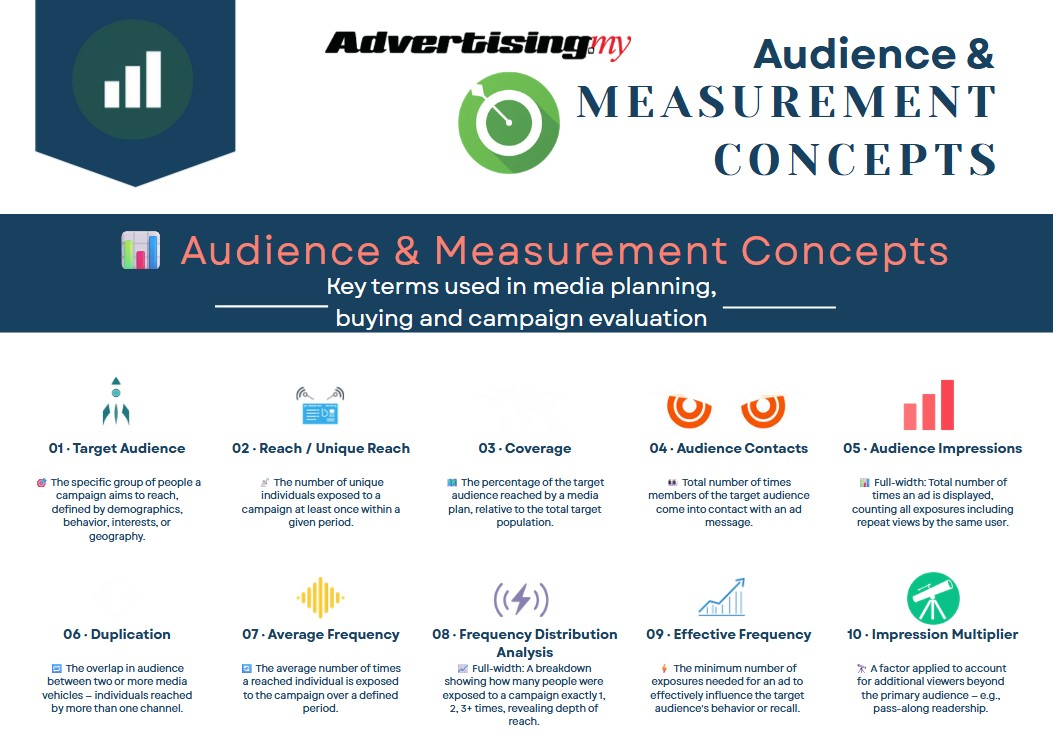
Audience & Measurement Concepts
Key terms used in media planning, buying and campaign evaluation
Target Audience
01
The specific consumer group a campaign aims to reach, defined by demographics, psychographics, behaviours or geography.
Demographic factors include age, gender, income, education and ethnicity. Psychographic factors cover interests, values and lifestyle. Behavioural targeting looks at purchase history, brand loyalty and media habits. Defining a clear target audience shapes every media decision — from channel selection to creative tone and scheduling.
Reach / Unique Reach
02
Total unduplicated number or percentage of the target audience exposed to content or ads at least once within a set time frame.
Reach counts each person only once, regardless of how many times they saw the ad. Expressed as a percentage of the target population (eg. 65% reach) or in thousands (000s). High reach is essential for brand launches and mass awareness campaigns. Reach and frequency are inversely linked — increasing one often decreases the other on a fixed budget.
Coverage
03
Audience impressions within a reported geographical area. Sometimes called reach percentage or reach in thousands (000s).
Coverage measures how well a media schedule penetrates a specific market or region. A campaign may achieve high coverage in urban centres but low coverage in rural areas due to media availability and population density. Coverage is critical for brands with regional distribution — there is no point reaching audiences where the product is not sold.
Audience Contacts
04
Count of people inside the cone of visibility of an OOH panel, calculated using ROTS and VAC. Each person is counted once per journey.
ROTS (Realistic Opportunity To See) counts pedestrians and drivers physically positioned to see the ad. VAC (Visibility Adjusted Contacts) refines this further by accounting for viewing angle, panel size, lighting and traffic speed. VAC gives a more accurate picture of actual exposure quality and is the primary currency for OOH media buying.
Audience Impressions
05
Total number of times an advertisement is viewed, including multiple exposures by the same person. Unlike reach, impressions are not deduplicated.
Impressions are the raw volume metric of advertising — measuring total campaign weight across all exposures. If 100 people each see an ad 3 times, that is 300 impressions but only 100 in reach. Impressions are used to calculate GRP (Gross Rating Points), which equals Reach × Frequency. High impression counts indicate a heavy campaign, but without reach data they do not reveal how many unique people were exposed.
Duplication
06
The repeated counting of the same person exposed multiple times — within a single medium or across different media channels.
Internal duplication is overlap within one channel. External duplication is cross-media overlap (eg. seeing your ad on TV and Instagram). Understanding duplication helps planners avoid over-serving the same audience and wasting budget on excess frequency beyond the effective level.
Average Frequency
07
Average number of times the target audience is exposed to content or ads in a defined time period.
Calculated by dividing total impressions by unique reach. Average frequency can be misleading — some people may see the ad 10 times while others see it once, yet the average appears normal. This is why Frequency Distribution Analysis provides a more complete picture.
Frequency Distribution Analysis
08
A detailed breakdown of how often people in the target audience saw the ad — reported as either cumulative or discrete frequency.
Cumulative frequency shows how many people saw the ad at least a certain number of times (eg. 3+, 5+, 10+) — revealing what portion of the audience has been meaningfully impacted. Discrete frequency shows how many people saw the ad exactly a set number of times. Together, these distributions help planners identify whether the campaign is under-reaching some audiences or over-saturating others, enabling smarter scheduling and budget allocation.
Effective Frequency
09
The number of exposures needed to make a meaningful impact and achieve a campaign’s communication goals.
Not a fixed number — varies by campaign objective, category complexity, creative quality and competitive noise. The traditional benchmark is 3+ exposures (Krugman’s ‘3+ Rule’). Effective Reach is the portion of the audience at or above this threshold. For complex messages, 5–7+ exposures may be needed.
Impression Multiplier
10
A value used to adjust raw impression counts to reflect the true number of potential views for a single ad play.
Used primarily in Digital OOH (DOOH) and programmatic outdoor buying. Because a single digital billboard play is seen by multiple people simultaneously, the multiplier accounts for average audience at that location at that moment. Derived from pedestrian counts, dwell time and panel visibility scores.